폐침착부하지수(LDLIn)를 이용한 플라스틱 종류별 연기입자의 폐 침착부하 정량화
Quantification of the Lung Deposition Load of Smoke Particles by Plastic Type with the Lung Deposition Load Index (LDLIn)
Article information
Abstract
요 약
화재에 의한 사상자는 대부분 연기흡입에 의해 발생한다. 연기 속의 입자상물질(PM)은 호흡기 벽에 침착되어 호흡기계 또는 순환기계를 통해 인체에 악영향을 미친다. 연기입자가 인체에 미치는 악영향을 추정하려면 공기 중 연기입자의 질량농도보다 호흡기 각 영역에서의 유해물질 흡수량을 고려하는 것이 합리적이다. 왜냐하면 인체에 미치는 악영향과 직접적인 관계가 있는 흡수량은 원인 인자인 공기 중 질량농도만으로 결정되지 않고 다양한 요인에 의해서 달라지는 결과 인자이기 때문이다. 이 연구에서는 종류별로 플라스틱(LDPE, PA66, PMMA, PVC)에서 발생하는 연기입자의 폐 침착부하를 폐침착부하지수(LDLIn)를 사용하여 정량화하고 이 값들을 PM10 및 PM2.5에 대한 기존의 PM 질량농도지수를 사용한 계산결과와 비교하였다. LDLIn 값은 연소물질 및 화재조건에 따라 화재시 생성된 연기입자에 대해 호흡기 각 영역에 침착된 입자수를 이용하여 계산되었다. LDLIn 계산에서 입경별 표면적 농도와 함께 입경 및 호흡조건에 따른 호흡기 내 침착특성을 반영하여 폐침착부하를 정량화하였다. 연구결과에 따르면 이들 연기입자는 각 재료 및 화재 조건에 따른 입자 직경별 농도분포의 변화에 따라서, 동일한 PM 질량농도지수 값에서도, 서로 다른 LDLIn 값을 가지며 이 값은 호흡조건에 따라서도 달라진다.
Trans Abstract
ABSTRACT
Many fire-related casualties are caused by smoke inhalation. The particulate matter in smoke is deposited on the walls of the respiratory system, and adversely affects the human body through the respiratory and circulatory systems. In order to estimate the adverse effects of smoke particles on the human body, it is reasonable to consider the quantity of harmful substances from smoke particles that are absorbed by each region of the respiratory tract rather than the mass concentration of smoke particles in the air. This is because the absorption amount is a consequent factor that depends on a wide variety of other factors and is not solely determined by the causative factor, that is, the mass concentration in the air. In this study, the lung deposition loads of smoke particles from plastics, such as LDPE, PA66, PMMA, and PVC were quantified using the lung deposition load index (LDLIn), and the results were compared with the findings of conventional particulate matter (PM) mass concentration indices, such as PM2.5 mass and PM10 mass. The LDLIn value was calculated from the number of smoke particles generated during a fire that were deposited in each region of the respiratory tract for the given combustion materials and fire conditions. Herein, the LDLIn quantified the lung deposition load by reflecting the surface area concentration by particle size as well as the deposition characteristics in the respiratory tract according to particle size and breathing conditions. Even at the same PM mass concentration index value, each material and fire condition resulted in different LDLIn values according to the change in concentration distribution by particle size. The LDLIn values also varied depending on the breathing conditions.
1. Introduction
Many fire-related casualties are caused by smoke inhalation. Particulate matter in smoke is deposited on the respiratory wall, and adversely affects the human body through the respiratory and circulatory systems(1,2). In order to estimate the adverse effects of smoke particles on the human body, it is reasonable to consider the amount of harmful substances from smoke particles that are absorbed by each area of the respiratory tract rather than the mass concentration of smoke particles in the air. This is because the absorption amount is a consequent factor that is affected by a variety of other factors and is not solely determined by the mass concentration in the air(3).
Compared to fine dust in the atmosphere, particulate matter in smoke generated during a fire differs in inhalation concentration and exposure time, as well as in the shape and composition of the particles. In addition, the amount and locations of particles deposited in the respiratory tract are affected not only by the breathing conditions according to the person’s activity state, but also by the particle conditions, which depend on the combustion materials and fire conditions during a fire(2). Therefore, in the study of the adverse health effects of smoke inhalation, it is essential to understand the deposition characteristics of the smoke particles in the respiratory tract by considering the combustion materials, fire conditions, and breathing conditions, and to express them in a single index that accurately represents the adverse health effects.
The quantity of fine particles in the air is on the rise due to rapid industrialization, and the adverse health effects of those particles are increasing accordingly. In addition, attention has been focused on the adverse health effects of ultra-fine particles in relation to lung deposition(3,4). In this regard, PM2.5 mass concentration (PM2.5mass) and PM10 mass concentration (PM10mass) are air quality indices that indicate the relative effects of air quality on health by expressing the total mass of particles 2.5 micrometers or less and 10 micrometers or less in diameters, respectively. Inhaled particles move through the respiratory tract and are deposited on the surface of the respiratory tract through mechanisms such as inertial impaction, gravitational sedimentation, and diffusion(5). The adverse health effects of the particles can be divided into two categories: direct damage to the surface of the respiratory tract, and damage due to substances that are absorbed into the respiratory and circulatory systems. The extent of damage varies from area to area in the lungs depending on sensitivity and degree of absorption at the surface of the respiratory tract(6,7).
In this regard, several studies have reported that the adverse health effects due to lung deposition are closely associated with the particle surface concentration(8,9). The rate at which harmful substances are desorbed from the particles and absorbed on the surface of the respiratory tract is theoretically correlated to the surface area of the particles. As a result, studies have attempted to analyze the adverse health effect of fine particles on the human body using the particle’s surface area as the main variable, rather than the mass of the particles (10,11). Therefore, it is necessary to consider that the adverse health effects of inhaled particles depend on the location and surface concentration of the particles, which are closely related to the rate of absorption in the respiratory tract. Moreover, the rate of absorption in the respiratory tract depends on the extent of particle deposition and the surface condition of the deposition zone, while the quantity and location of these deposited particles depend on the particle size and breathing conditions(7,12,13). However, current total particle mass spectrometry measures, such as PM10mass and PM2.5mass, do not consider the particle size distribution, surface area concentration of the particles, or the deposition location in the lungs(14,15). Therefore, it is necessary to develop an improved indicator of the adverse health effects that considers the amount of absorption of harmful substances from smoke particles.
In this study, the lung deposition loads of smoke particles from plastics, such as LDPE, PA66, PMMA, and PVC were quantified using the lung deposition load index (LDLIn), and the results were compared with the findings of conventional PM mass concentration indices, such as PM2.5mass and PM10mass. The LDLIn value was calculated from the number of deposited particles generated by a fire in each area of the respiratory tract, depending on the combustion materials and fire conditions. The LDLIn quantified the lung deposition load by reflecting the surface area concentration by particle size as well as the deposition characteristics in the respiratory tract according to particle size and breathing conditions.
2. Methods
2.1 Size Distribution of Smoke Particles
In this work, the particle size distribution of the experimental study of Goo and Hwang(16), which measured the particle size distribution of smoke particles generated from Low density polyethylene (LDPE), Polyamide 66 (PA66), Polymethyl methacrylate (PMMA), and Polyvinyl chloride (PVC), was used to compare the smoke particles from plastics at the same temperature and equivalence ratio for each fire stage specified in ISO/TS 19700(17,18). Goo and Hwang(16) used the steady-state (equivalent ratio) tube furnace method for the generation of smoke particles under the fire conditions of S1b, S2, S3a, and S3b specified in ISO/TS 19700, as shown in Table 1. The materials were transported to the furnace at a feed rate (ṁf) of 1 g/min, with the primary air Qp, at the maximum flow rate of 20 L/min. Secondary air enters the mixing chamber with the sum of the primary and secondary air flow rates of 50 L/min.
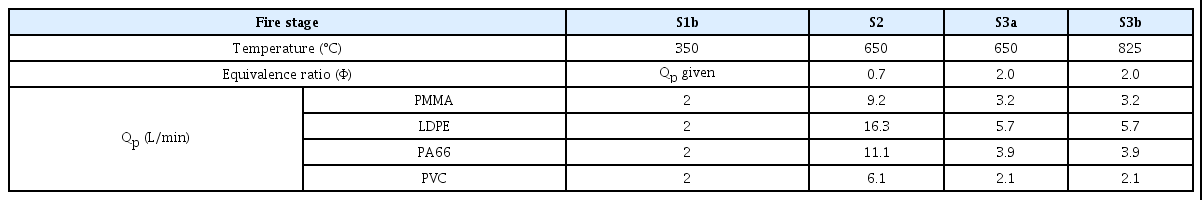
The aerodynamic size distributions of the particles were measured using an electric low-pressure impactor (Dekati, ELPI+)(19). It is used in the measurement of particle size distributions that vary over time in the particle size range of approximately (0.01-10) μm by aerodynamic diameter (19,20,21). Table 2 presents particle diameters at each stage and channel, where, di50 is the aerodynamic diameter cut by 50% in the i-th impactor stage, and di is the aerodynamic diameter of the particle in the i-th channel.

2.2 Deposition Fraction in the Lung
The human respiratory tract consists of an extrathoracic region and a bifurcating airway, consisting of a continuous bifurcating structure of about 23 generations(22). The extrathoracic region consists of the nasal cavity, mouth, pharynx, and larynx(6,7). According to Weibel’s regular dichotomy model(22), bifurcation begins in the trachea, which is defined as the 0th generation, and is divided into the left and right lungs in the main bronchi, which represent the 1st generation. Generations (0 to 16) are tracheobronchial regions, while generations (17 to 23) are pulmonary regions. These generational branch tubes can be divided into the generation terminal bronchus (11th), generation terminal bronchiole (16th), generation respiratory bronchioles (17th to 19th), generation alveola ducts (20th to 22nd), and generation alveolar sacs (23rd).
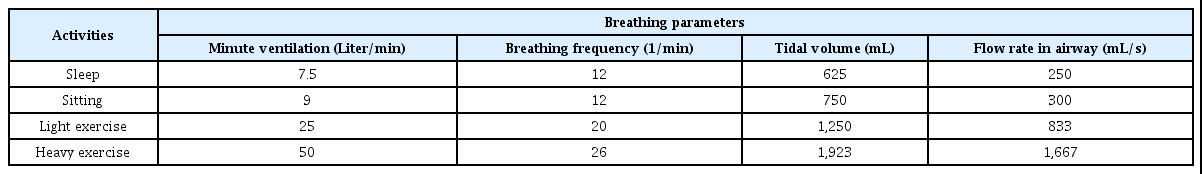
Numerous studies have been conducted in relation to the selection of respiratory model and calculation of deposition fraction(7,23). In this study, the size of the branch tube for each generation when the lung volume was 4,800 mL in Weibel’s symmetric bifurcating model(22) was applied, in order to calculate the deposition amount. The functional residual capacity (FRC) was 3,250 mL, and the size of the branch tube was adjusted so that the branch tube volume was determined for each generation in proportion to this, while the data of Yeh and Schum(24) were used for the morphology. In respiratory deposition, the amount of deposition is dependent on the breathing condition. Breathing conditions include activity and inlet states. Among the four activity states defined in ICRP(7) shown in Table 3, the sitting state and the heavy exercise state were considered. The inlet state was categorized into mouth breathing, and nasal breathing. Calculation of particle deposition was conducted using Weibel’s symmetric bifurcation respiratory system model(22) via the volume segment tracking method (VSTM)(25,26). Goo(25,26) applied the VSTM concept to the stochastic variation method and asymmetric lung model, respectively. However, in this paper, it was applied to the deterministic method that the airway morphology is uniform for the same generation, and the symmetric lung model.
The brief concept of VSTM is as follows. When calculating total and local deposition, each branch tube is partitioned into volume segments that correspond to the total volume of each generation. The particles within each volume segment are deposited as air passes through the other generation branch tubes during breathing. During inhalation, the tidal volume (VT) enters the inlet of the respiratory tract as a result of the pressure difference caused by the action of the diaphragm, and the generational volume of each branch tube expands for air to move. For convenience, the external air is expressed as the -2 generation, while the extrathoracic region is expressed as the -1 generation, so that it is connected to the trachea (0th generation). During air movement, all or part of the air in any s generation moves to the e generation, and the corresponding volume segment is denoted by Vse. The deposition fraction of the particles when this volume segment passes through generation j during inhalation is defined as DFjseI. This can be expressed as:
where, CjN is the ratio of the number concentration in the jth generation, relative to the respiratory inlet concentration i.e., C-2N = 1, and ηj is the particle deposition efficiency at generation j(25,26). The deposition fraction during inhalation for generation j (DFjI) can be obtained by the summation of all s and e passing through generation j in one breathing cycle. The deposition fraction during exhalation (DFjE) is calculated in a similar manner, and summing the two gives the deposition fraction in the jth generation (DFj). When this calculation is applied to the ith particle size, the deposition fraction in the jth branch tube of the ith particle (DFij) can be obtained.
The particle deposition efficiency ηj is the ratio of the number of deposited particles, to the total number of particles contained in the air and introduced into a branch tube of a given jth generation. This deposition efficiency is obtained from the deposition efficiency for all the deposition mechanism, that is, the deposition efficiency by diffusion (PD), gravitational sedimentation (PS), and inertial impaction (PI). The deposition efficiency for the jth generation is expressed as follows:
The deposition efficiency of each mechanism is influenced by the dimension and morphology of the airway branch, flow velocity, and particle size for each generation. As the Weibel model(22), it is assumed that the lungs consist of a series of single branch tubes, and the equations of Yeh and Schum(24) and Kim and Fisher(27) are applied to obtain the deposition efficiency. For the extrathoracic region, the deposition efficiency equations for impaction and diffusion were applied for both oral and nasal breathing(28,29).
2.3 Development of the Lung Deposition Load Index (LDLIn)
The index representing the degree of lung deposition load of smoke particles was obtained by considering the particle loads of different amounts deposited in different generations by size and breathing conditions in the lung. The input data requires the number concentration of particles in the air by particle size, and there are different parameters in relation to particles and lungs. The particle-related parameters include mass, surface area, and number concentration. The lung-related parameters consist of breathing conditions, surface area, and health effect weighting by generation.
The lung deposition load index (LDLIn) can be expressed as follows using the number concentration (Ni) of particles with a diameter di obtained in section 2.1, and the deposition fraction (DFij) of the particle di in the jth generation obtained in section 2.2.
where,
where, W is the conversion factor, Np is the total number of channels, Js is the starting number of generation, Ni is the number of the particles for the size di, DFij is the deposition fraction of the particle di in the jth generation, di (μm) is the aerodynamic diameter of the particles in the ith channel, do (1 μm) is the unit particle diameter, di50 (μm) is the aerodynamic diameter of 50% cutoff in the ith impactor stage, AGj (cm2) is the total surface area of the jth generation, Xj is the health effect weighting for the jth generation, NCi (1/cm3) is the number concentration of particles for the ith channel, Vm (L / min) is the minute ventilation, and ∆T (1 min) is the breathing time. The default value of 1 was entered as the health effect weighting (Xj) for the jth generation.
3. Characteristics of the Lung Deposition Fraction and LDLIn
This section shows the change in lung deposition fraction according to particle size distribution and respiratory conditions, for a better understanding of LDLIn. In addition, it shows the characteristics of the change in LDLIn value according to the change of deposition fraction and option values for the sampled reference particle size distribution.
3.1 Deposition Fraction in the Lung
Using the volume segment tracking method (VSTM), DFij was calculated for a single lobe model, a deterministic method, and a FRC value of 3,250 mL. Figure 1 shows the deposition fraction (DFij) values of the particle di in the jth generation for the cases where the activity state includes sitting and heavy exercise, and the inlet state is mouth breathing or nasal breathing.
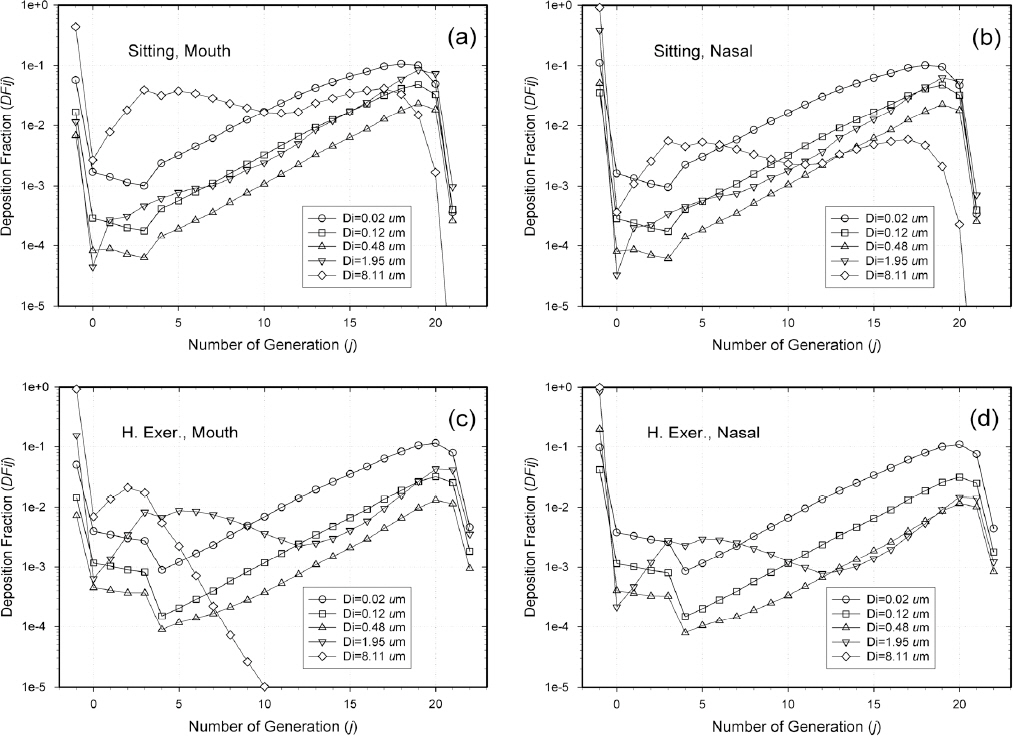
Deposition fractions of the particle di in the jth generation (DFij) for: a) mouth breathing while sitting; b) nasal breathing while sitting; c) mouth breathing when doing heavy exercise; d) nasal breathing when doing heavy exercise.
The value at generation -1 is the deposition fraction of the entire extra-thoracic region that passes through the mouth or nasal cavity, and is located at the beginning of the respiratory tract, thereby depositing a large amount of large particles. Generation 0 represents the main trachea, generation 1 represents the first bifurcating branch, and Figure 1 shows the deposition fraction for each generation up to 23 generations.
In the case of heavy exercise and mouth breathing, the tidal volume and flow rate are increased, thus deposition mainly occurs at the lower branch as compared to the case of mouth breathing and sitting. In addition, the deposition fraction of large particles in the upper airway increases, due to the increase in inertial impaction. In the case of sitting and nasal breathing, the deposition fraction of large particles in the nasal cavity is significantly higher than in the mouth, and the number of particles supplied to the branches decreases; hence, the deposition fraction in the branches is decreased.
In the case of heavy exercise, relatively small particles show a large variance between generations 3 and 4. This is because the deposition efficiency (PD) for diffusion in a branch tube is different for laminar and turbulent air flow conditions. Specifically, in this breathing condition, the flow is turbulent until generation 3, and from generation 4 changes to laminar, so that from generation 4, the deposition fraction decreases. For the generations (from 0 to 5), the deposition efficiency value is uneven. This is because these generations correspond to the inlet branch tubes entering 5 lobes, the number of branches is small, and the morphological parameters, such as the length and diameter of the branch tube, are uneven.
3.2 A Particle Size Distribution Sampled from Ambient Air, and its Variations
To use as a reference concentration distribution, and to quantitatively examine the characteristics of changes in LDLIn values due to changes in particle size distribution, particles in the general atmosphere were sampled. The distribution of the number concentration by particle size in the ambient air was measured using an electrical low-pressure impactor(19). The measured value is represented by a circular symbol and a dotted line as in Figure 2, and this value is called Sample 1. These measurements were taken in an indoor laboratory at the time the PM10mass and PM2.5mass in the local outdoor area were established to be 20 and 9 μg/m3, respectively. The PM10mass was measured to be 1.510 × 10² μg/m3, while the PM2.5mass was found to be 1.426 × 10⁻¹ μg/m3.

Geometric concentration of particle sample and its variations for: a) number, and b) volume.
In order to see the change in the LDLIn with the size distribution, the geometric number concentration distribution by size was changed to various distributions from the measured value (Sample 1). Figure 2a presents an artificially changed geometric number concentration distribution in order to see the effects of concentration variation, while Figure 2b shows a geometric volume concentration distribution calculated according to the change in Figure 2a.
The measured value, Sample 1, was roughly fitted as follows. A straight line connects the point at which the geometric number concentration is (1.0 × 10⁵)/cm3 with a particle size of 0.01 μm, and the point where the geometric number concentration is (1.0 × 100)/cm3 at a particle size of 10 μm. This results in a straight line with a slope of -5/3 connecting (-2, 5) and (1, 0) points with (x, y) coordinates when y = ax + b in the x, y plane, as shown below. Let this straight line be FitS1.
The values of PM2.5Vol and PM10Vol, which represents the sum of the volume for particles of (2.5 and 10) μm or less in relation to this straight line, are (2.476 × 101 and 1.652 × 10²) μm3/cm3, respectively. Since the particle diameter used here is aerodynamic diameter, and the density of the particle is ρP = 1 g/cm3, the mass-based PM2.5mass and PM10mass are (2.476 × 101 and 1.652 × 10²) μg/m3, respectively.
In this calculation, the sum of channels (1 to 14) was used for PM10, considering the di50 value of up to 9.88 μm for stage 15. For PM2.5, the sum of channels (1 to 11) was used, considering the di50 value of up to 2.38 μm for stage 12. For this straight line, the straight lines with the same PM10mass values and slopes of a = (-1 and -2) are referred to as variA and variB, respectively as shown in the Figure 2. A straight line with the same PM2.5mass value and a slope of a = (-1 and -2) is referred to as variC and variD, respectively. Then, the values of (a, b) of these straight lines are (-1, 1.187), (-2, 1.871), (-1, 1.599), and (-2, 1.665) for variA, variB, variC, and variD, respectively.
3.3 Characteristics of the LDLIn
For a better understanding of LDLIn, the LDLIn values for typical particle size distributions described in the section 3.2 were compared with conventional PM10mass and PM2.5mass. Also the charcteristics of changes in LDLIn value with particle surface area, mass distribution, size distribution, and respiratory conditions were studied.
3.3.1 Comparison of LDLIn Values with the Existing PM10mass and PM2.5mass
Table 4 shows the LDLIn2.5 and LDLIn10 values for particles having a particle size of (2.5 and 10) μm or less, respectively, obtained by varying the option values for the FitS1 concentration distribution.

Comparison of LDLIn Values with the Existing PM10mass and PM2.5mass
Case 1 shows option values based on a similar concept as the existing PM10mass or PM2.5mass. That is, S = 0, the deposition fraction term (DFij) is 1, and divided by 25 in W to remove the influence of the deposition fraction on 25 distinct generations, and R = 0 to eliminate the effect of the surface area term (AGj). In addition, P = 3, multiplied by π/6 in W to obtain the volume, Vm is 1/1,000, converted to the volume (μm3) of particles per cm3, summed over the total NP = 14 particles. Therefore, it can be seen that the LDLIn value obtained is consistent with the existing PM value, as follows: 10LDL In 2.5 = 101.394 = PM2.5vol = 2.476 × 101 μm3/cm3, 10LDL In 10 = 102.218 = PM10vol = 1.652 × 102 μm3/cm3. Since we are using aerodynamic diameter, the density of the particles is ρp = 1 g/cm3; hence, PM2.5mass and PM2.5mass are (2.476 × 101 and 1.652 × 10²) μg/m3, respectively.
Case 4 considers the deposition fraction term by changing S = 0 to S = 1 from Case 1. Since deposition is made in 25 generations, Case 2 is also divided by 25 in W, in order to compare the result with the case where the deposition fraction term is not considered. Comparing Cases 4 and 2, in Case 4, which considers the deposition fraction term, the decreasing ratio of 10LDL In10 value is 102.446/102.499 = 0.8851 compared to Case 2, which does not consider the deposition fraction term. This ratio is equal to the mass ratio of the particles deposited. Case 5 considers the effect of the surface area of the branch tube for each generation with R = 1 from Case 4. In this case, if the total surface area of the generation number with a lot of deposition is large, the LDLIn result value is correspondingly large.
3.3.2 Changes of LDLIn Values According to the Particle Surface Area and Mass Distribution
As highlighted in the introduction, since the degree of adverse health effect due to lung deposition is dependent on the particle surface area concentration, when applying the particle surface area distribution, and when applying the mass distribution, it is necessary to compare the change characteristics of LDLIn. Herein, when the number, surface area, and volume (or mass) of each of the particles are applied to the LDLIn calculation formula, the characteristics of the resultant LDLIn value according to the number concentration distribution of the particles are examined.
In Table 5, Cases 6 and 7 correspond to the case where the volume or mass concentration of particles is applied (P = 3). In this condition, VariA, which has the same PM10mass value as the standard particle size distribution FitS1 and the reduced number concentration of small particles, was compared. In Cases 8 and 9, the same comparison was made when the surface area concentration of the particles was applied (P = 2), and in Cases 10 and 11 when the number concentration of particles was applied (P = 1). The LDLIn value is smaller in VariA compared to FitS1, and it can be observed that the decreasing rate increases in the order of volume, surface area, and number.

LDLIn Values Showing the Effect of the Number, Area, and Volume of Particles
3.3.3 Changes of LDLIn Values According to Size Distribution
In the assumption that adverse health effect as a result of the deposition of particles is proportional to the amount of substances absorbed from the particles into the body, it is important to consider the case where P = 2 is applied in the LDLIn calculation formula, since the desorption rate is proportional to the surface area of the particles. Table 6 shows the change in LDLIn value according to the change in particle number distribution under sitting and nasal breathing conditions when the particle surface area is applied.
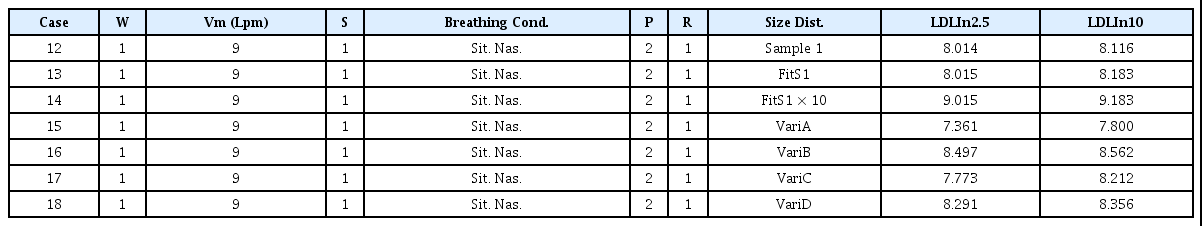
LDLIn Values Showing the Effect of the Size Distribution
Cases 12 and 13 are comparisons between Sample 1 and the size distribution of FitS1. If the distribution is similar, then the LDLIn values appear the same. Case 14 presents a case where the number concentration at each particle diameter is 10 times that of Case 13, and both the LDLIn2.5 and LDLIn10 values are increased by unity. That is, when the number concentration is uniformly increased 10 times for each particle size under the similar concentration distribution in air, the LDLIn value increases by 1. This means that when the lung deposition load (LDL), which is directly related to the adverse health effect, is 10 times the load due to the particles deposited in the lung, the difference in LDLIn value equals 1. Cases 15 and 16 presents cases where the slope of the concentration distribution changes in the same PM10mass as in Case 13. When the number of small particles is smaller (Case 15), the LDLIn value is smaller than the original value; and when the number of small particles is larger (Case 16), the LDLIn value is larger than the original value. Cases 17 and 18, where the concentration distribution slope changes in the same PM2.5mass, exhibit similar characteristics.
3.3.4 Changes of LDLIn Values According to Breathing Condition
Table 7 shows the change of the LDLIn value according to the particle number distribution change for various breathing conditions when the particle surface area is applied. Case 19 presents the case where the breathing condition was changed from sitting and nasal breathing in Case 13, to sitting and mouth breathing. Since the particles that do not deposit in the nasal cavity enter the branch and some of them deposit there, the difference is significant in large particles. Case 20 presents the case where the breathing condition was changed from sitting and nasal breathing in Case 13, to heavy exercise and nasal breathing. As explained in section 3.2, as the tidal volume and flow rate increases, the deposition fraction increases in each generation, and the effects of increasing the number of particles entering the respiratory tract per unit time through exercise from both the increases of tidal volume and flow rate are exhibited, resulting in a large LDLIn value.
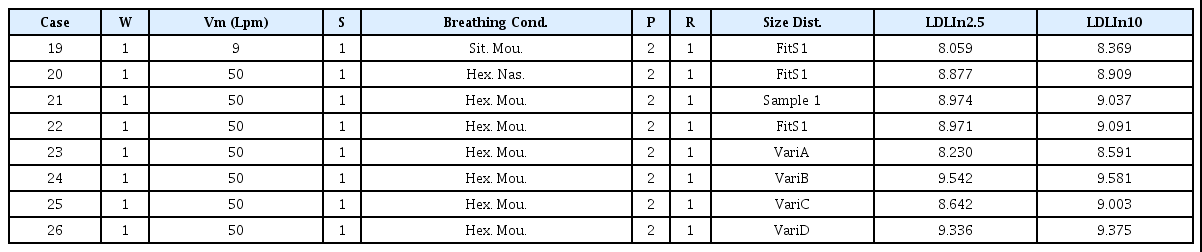
LDLIn Values Showing the Effect of Breathing Condition
Case 22 is the case where the breathing condition in Case 13 is changed from sitting and nasal breathing to heavy exercise and mouth breathing. The effect of changing each of the above conditions is comparatively shown. Cases 21 and 22 are the cases of changing the sitting and nasal breathing conditions of Cases 12 and 13 to heavy exercise and mouth breathing conditions. As both the minute ventilation (Vm), related to the amount entering the respiratory tract, and the deposition fraction, as the fraction deposited in the respiratory tract, increase, the LDLIn value increases. Cases 23-26 represent the case where the number concentration distribution changes, and has the same change characteristics as the previous explanation of Cases 15-18.
4. Results
The degree of lung deposition load of smoke particles from LDPE, PA66, PMMA, and PVC was quantified using the lung deposition load index (LDLIn), and compared with the results using the conventional PM mass concentration indices.
The particle concentration distribution data collected from the mixing chamber connected to the tube furnace of Goo and Hwang(16) was used, and the concentration distribution of the particle diluted by exposure to the atmosphere was calculated and used in this study. That is, in order to differentiate the adverse health effects according to the concentration distribution by particle size, the results were compared under diluted conditions to have the same PM mass concentration (PMmass) value as Sample 1 collected in the air. The relative concentration distribution by particle size is the same, and the number concentration in each particle size is reduced using the same ratio, in order to achieve the same PM10mass value as Sample 1 described in section 3.
Figure 3a shows the original size distributions of smoke particles from the mixing chamber(16), and Figure 3b compares the diluted size distributions to have the same PM10mass as Sample 1 for typical combustion materials and fire conditions. The particle size distributions are represented by PA66_S1b and PA66_S2, respectively, in S1b and S2 fire conditions for PA66, and by PVC_S1b and PVC_S2 in S1b and S2 fire conditions for PVC, respectively. In comparison to Figure 2, channel 1 is excluded, and sizes are measured in the channels corresponding to di = (0.0213-8.1118) μm in Figure 3. Figure 3b shows that the concentration distribution of smoke particles diluted to have the same PM10mass value differs, depending on the conditions particles were generated. Therefore, it can be predicted that their characteristics of lung deposition will differ. Table 8a, 8b and 8c compare the PMmass values and LDLIn values for each combustion material, fire condition, and breathing condition that were obtained for the original and diluted concentration distribution shown in Figure 3a and Figure 3b.
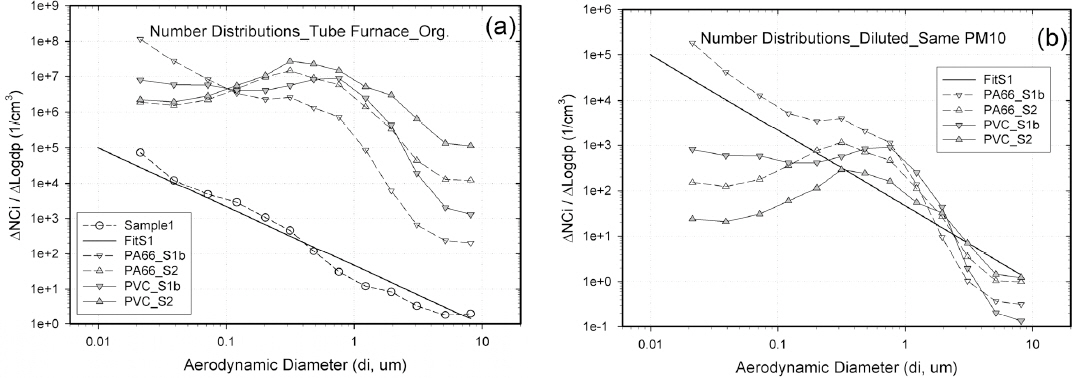
Geometric number concentrations of: (a) original smoke particles from mixing chamber(16), and (b) diluted smoke particles to have the same PM10mass as Sample 1.

LDLIn Values for the Particles Sampled from Ambient Air
LDLIn Values for the Smoke Particles from LDPE and PA66

LDLIn values for the smoke particles from PMMA and PVC
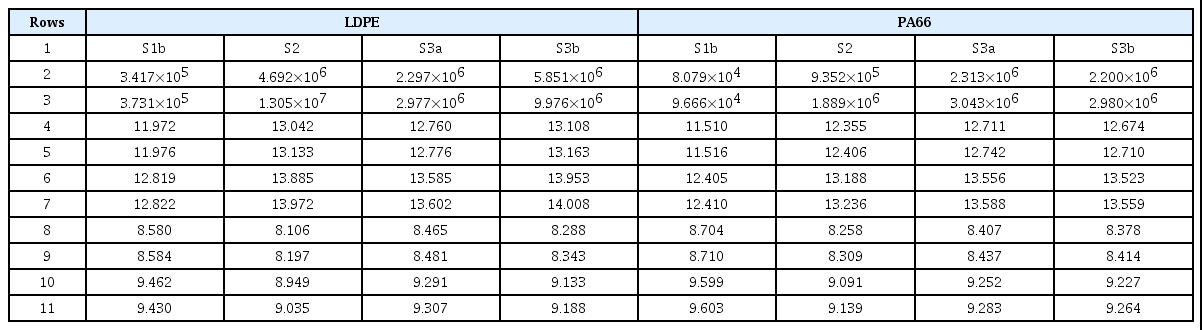
Table 8a, 8b and 8c use the particle size distributions obtained from the experiment of Goo and Hwang(16) for LDPE, PA66, PMMA, and PVC under each combustion condition. The option values of W = 1, S = 1, P = 2, and R = 1 were applied in the calculation of LDLIn. The surface area of particles was considered using the option value of P = 2, and weighting according to the lung depth was reflected using the option value R = 1. The description of each row, shown in the middle column of Table 8a, applies also to Table 8b and 8c.
In the row numbers indicated in Table 8a, 8b and 8c, row 1 shows each material or fire condition, rows 2-3 show the PMmass values at the original concentration, and rows 4-7 show the LDLIn values for each breathing condition at the original concentration of the smoke particles. Also, rows 8-11 show the LDLIn values for each breathing condition at the particle concentration diluted to have the same PMmass value as Sample 1.
At the original concentration, comparing the PMmass value and the LDLIn value, the LDLIn value is generally large when the PMmass value is large, as shown in rows 2-3, and 4-7 of Table 8a, 8b and 8c. This is because the absolute value of PMmass varies greatly, depending on the material and fire conditions. However, since the PMmass value represents the total mass concentration in the air, while the LDLIn value represents the amount of particle surface area deposited in various areas of the lung, the values are different, depending on the concentration distribution, according to the particle diameter. For example, in the case of LDPE shown in Table 8b, in the case of S3b compared to S2, the PM10mass value is smaller, but the LDLIn values are larger.
In the diluted concentration to have the same PMmass value, comparing rows 2-3, and 8-11 of Table 8a, 8b and 8c, each material and fire condition has different LDLIn values, depending on the concentration distribution change by particle diameter, regardless of the original PMmass value. In the following, LDLIn values for sitting and nasal breathing were compared first, to simplify the comparison. That is, when looking at the difference according to the fire conditions, in the case of PA66, the PM10mass value shows the order S3a > S3b > S2 > S1b, while the diluted LDLIn10 value shows the order S1b > S3a > S3b > S2. In the case of PVC, the PM10mass value shows the order S2 > S3b > S3a > S1b, but the diluted LDLIn10 value shows the order S1b > S3a > S3b > S2. On the other hand, when looking at the difference according to the material, in the fire condition of S1b, the PM10mass value shows the order PVC > PMMA > LDPE > PA66, but the diluted LDLIn10 value shows the order PA66 > LDPE > PMMA > PVC. In the S2 fire condition, the PM10mass value shows the order PVC > LDPE > PMMA > PA66, but the diluted LDLIn10 value shows the order PA66 > PMMA > LDPE > PVC.
As described above, even if they have the same PM10mass value, when the concentration distribution according to the particle diameter is different, the LDLIn10 value is different. To compare the effect of ultrafine particles, PM2.5mass and LDLIn2.5 values can be compared in the tables. Also in this case, there is a difference between the order of PMmass values and the order of LDLIn values. In addition, by comparing the LDLIn value for sitting and nasal breathing, and for heavy exercise and mouth breathing, it can be predicted how the LDLIn value changes under different breathing conditions, which is not reflected in the PMmass values.
The characteristics of the LDLIn value changes, for the particle size distribution of sample 1 and its variations, and their reasons for the changes described in Section 3, are compounded in Section 4. As observed in Table 8a, 8b and 8c, in the particle size range where the surface area of the particle is large and deposits deep in the lung at the same time, the particle size distribution with high concentration has a high LDLIn value. Since the larger the particle size, the larger the surface area, it may be considered that the LDLIn value is high in a distribution having a high concentration in a region having a large particle size. However, it can be seen that the LDLIn value is high in the particle size distribution with a high number concentration in the particle size range of approximately (0.2-2.0) μm, since larger particles are deposited in the upper part of the respiratory tract, and are unlikely to penetrate deeply into the lung.
5. Conclusion
In this study, the lung deposition load of smoke particles from LDPE, PA66, PMMA, and PVC under various conditions was quantified using the lung deposition load index (LDLIn), and the results were compared with the findings of conventional PM mass concentration indices, such as PM2.5mass and PM10mass. The lung deposition load index was calculated from the number and surface area of particles that are deposited variedly on the respiratory tract, depending not only on the breathing conditions but also on the particle conditions which depend on the combustion materials and fire conditions during a fire.
In the particle size range where the surface area of the particle is large and deposits deep in the lung at the same time, the particle size distribution with high concentration has a high LDLIn value. In the particle size distribution with a high number concentration in the particle size range of approximately (0.2-2.0) μm, the LDLIn value can be seen to be high. The lung deposition load depends on the combustion materials, fire conditions, and breathing conditions, which can be seen from the change in LDLIn value. This change is not reflected in the conventional PM mass concentration values.
Acknowledgements
This work was supported by a National Research Foundation of Korea (NRF) grant (No. 2019R1F1A1040925), funded by the Korea government (MSIT).